Layer data
- Example data
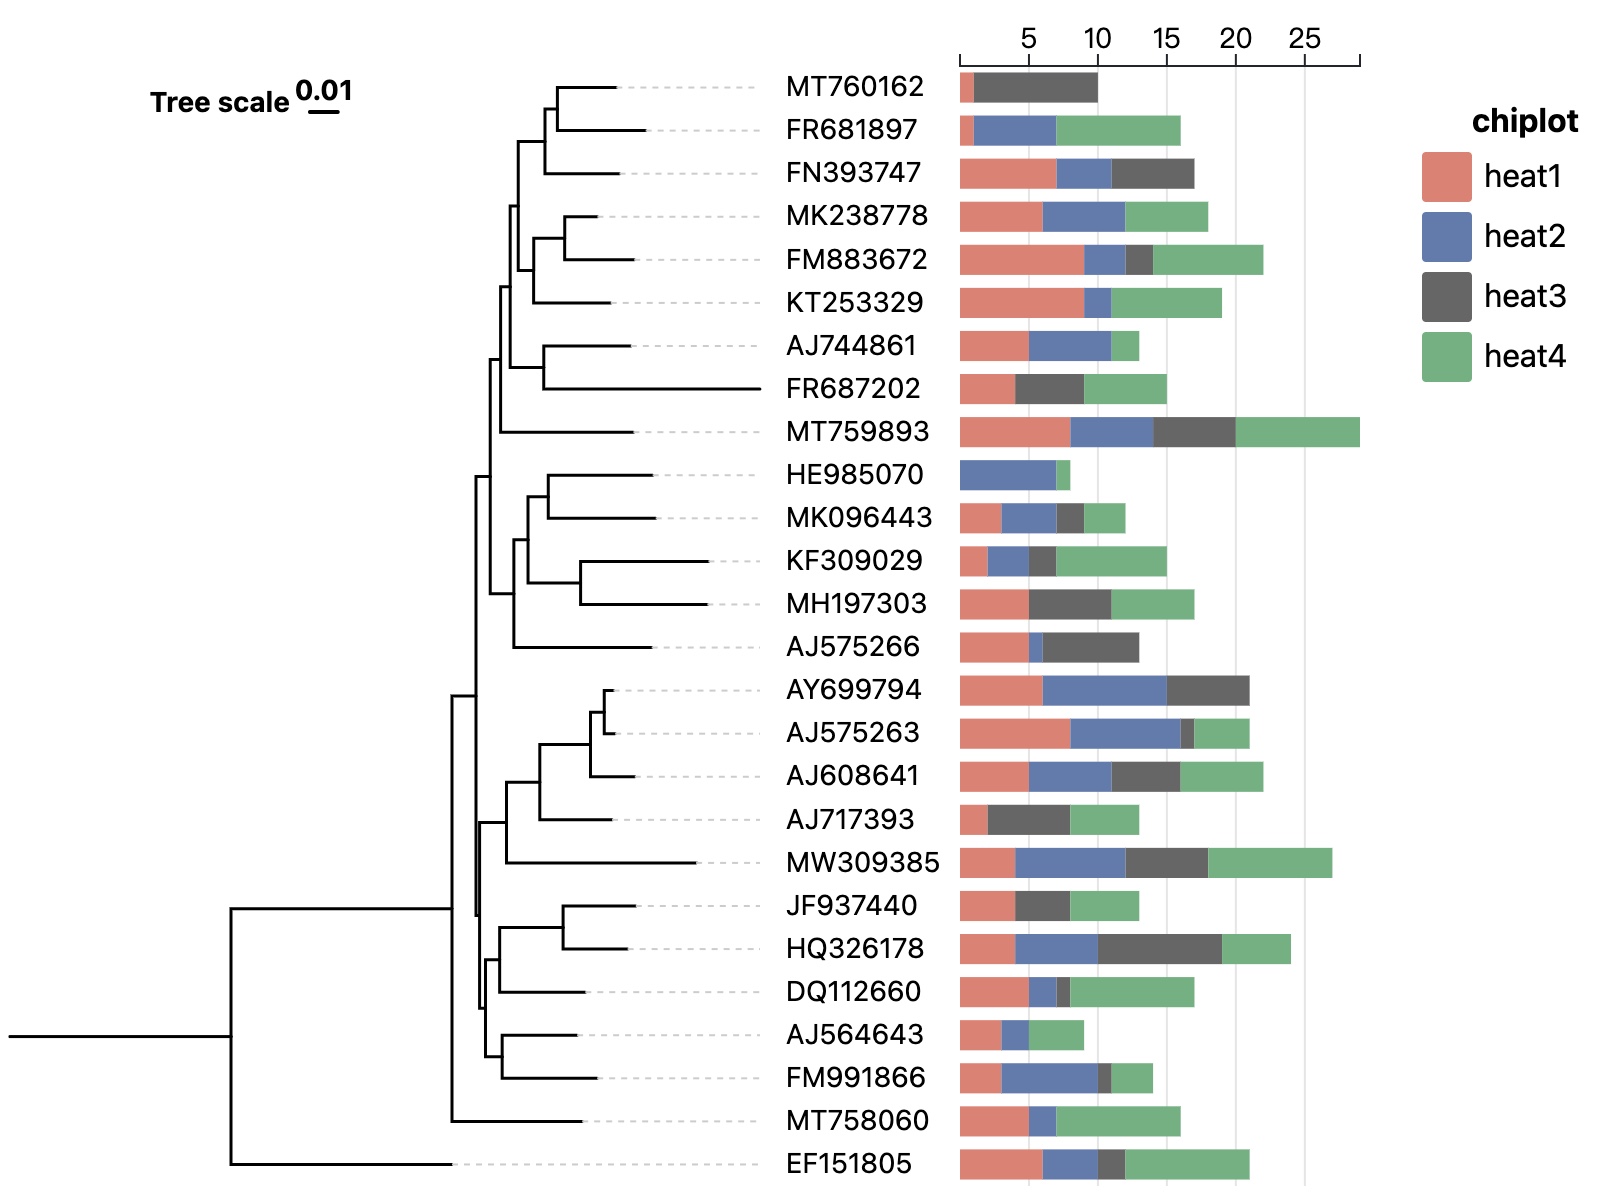
Multiple columns of numerical data are needed. Each column name is one category.
| Node IDs | component 1 | component 2 | component 3 | component 4 | ... |
|---|---|---|---|---|---|
| MT758060 | 5 | 13 | 33 | 46 | ... |
| EF151805 | 9 | 34 | 56 | 77 | ... |
| MW309385 | 12 | 33 | 66 | 88 | ... |
| AJ717393 | 13 | 22 | 77 | 66 | ... |
- TSV format
Node IDs    component 1    component 2    component 3
EF151805    6    4    2
AY699794    6    9    6
AJ608641    5    6    5
JF937440    4    0    4
AJ744861    5    6    0
AJ564643    3    2    0
FN393747    7    4    6
AJ717393    2    0    6
MK238778    6    6    0
AJ575266    5    1    7
MT758060    5    2    0
MT760162    1    0    9
NR_025743    9    0    7
FM883672    9    3    2
HE985070    0    7    0
FR687202    4    0    5
KT253329    9    2    0
HQ326178    4    6    9
MT759893    8    6    6
KF309029    2    3    2
FM991866    3    7    1
MH197303    5    0    6
FR681897    1    6    0
MW309385    4    8    6
DQ112660    5    2    1
AJ575263    8    8    1
MK096443    3    4    2
Layer controlling attributes
canvas
xAxis
background
bar
Color set
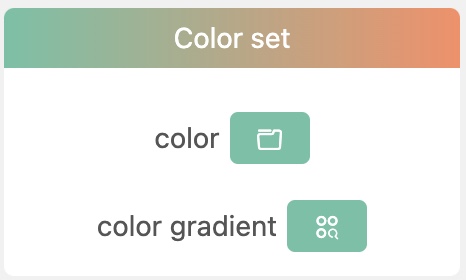
color: Click this button to choose a default color set.
color gradient: Click this button to choose a default color set from a gradient color bar depending on the number of categories.
Custom color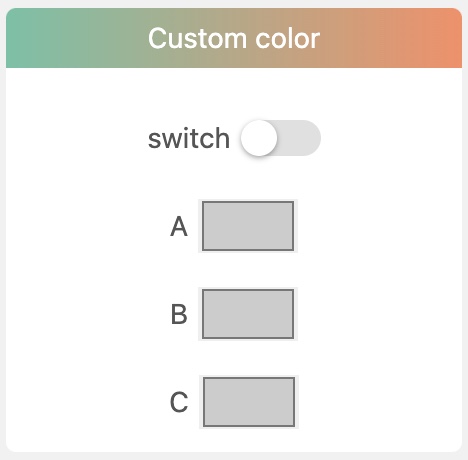
switch: Whether to use custom color set.
All categories of that data column will be listed below followed by a color selector respectively. Click each color selector to select a color you like.
Bar style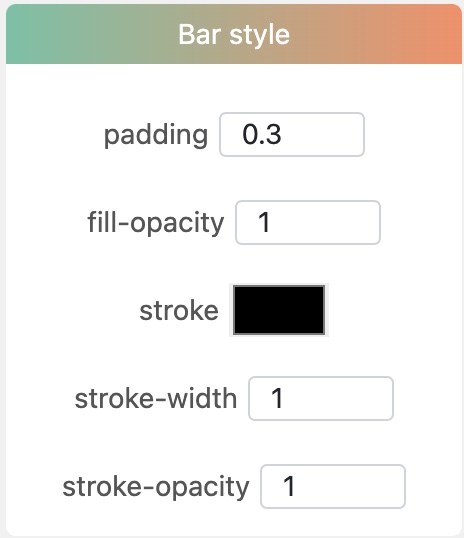
padding: Adjust the spacing between two bars.
fill-opacity: Svg rect attribute.
stroke: Svg rect attribute.
stroke-width: Svg rect attribute.
stroke-opacity: Svg rect attribute.