Layer data
- Example data
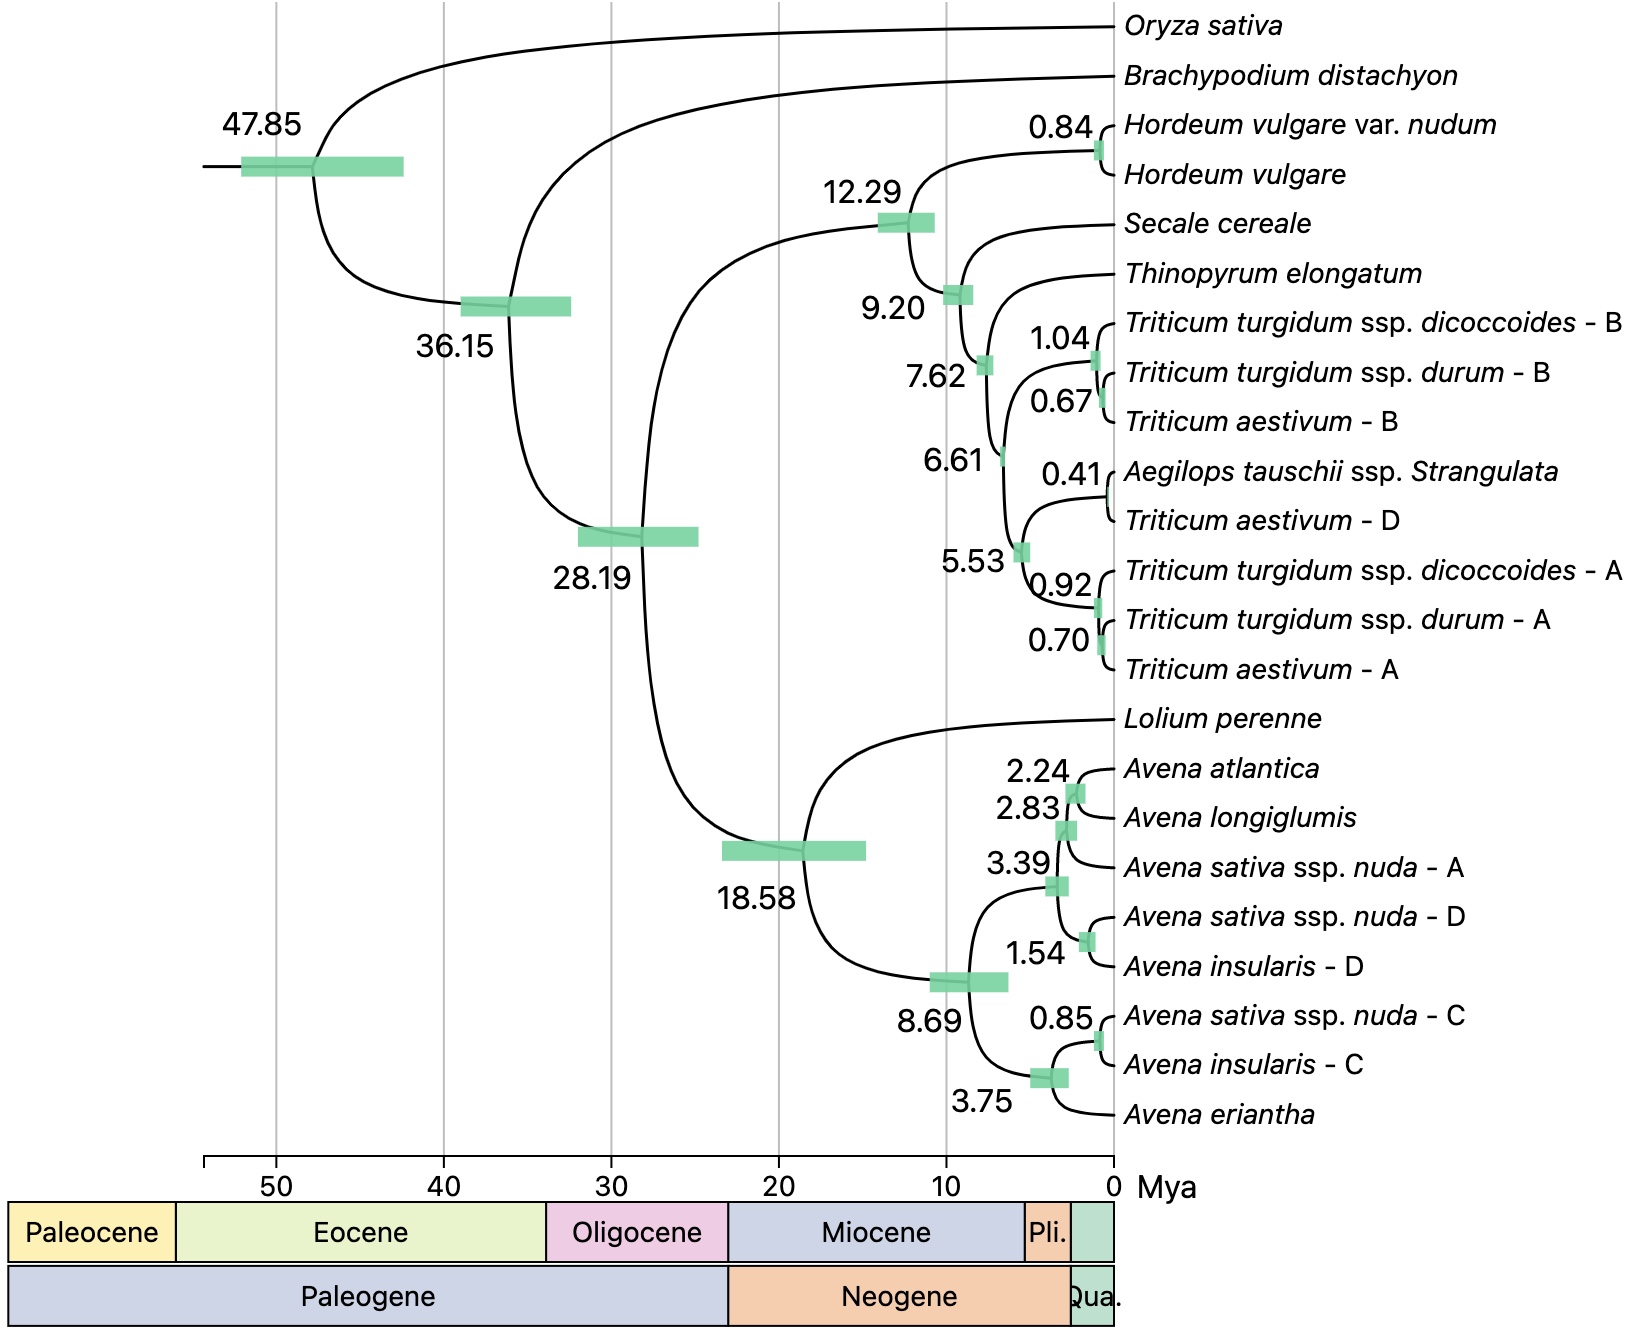
The first column is period ID which can be customized, but must be unique. The second column is period name. The third column is the start of this geologic time. The 4th column is the end of this geologic time.
| Period IDs | period | start | end |
|---|---|---|---|
| p-1 | Pli. | 5.33 | 2.58 |
| p-2 | Miocene | 23.03 | 5.33 |
| p-3 | Oligocene | 33.9 | 23.03 |
| p-4 | Eocene | 56 | 33.9 |
- TSV format
Period IDs    period    start    end
p1    Pli.    5.33    2.58
p2    Miocene    23.03    5.33
p3    Oligocene    33.9    23.03
p4    Eocene    56    33.9
Layer controlling attributes
period
Position
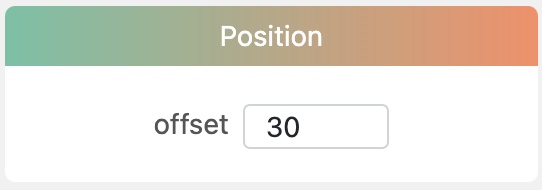
offset: Vertical offset of the time scale.
Color set

color: Click this button to choose a default color set.
Custom color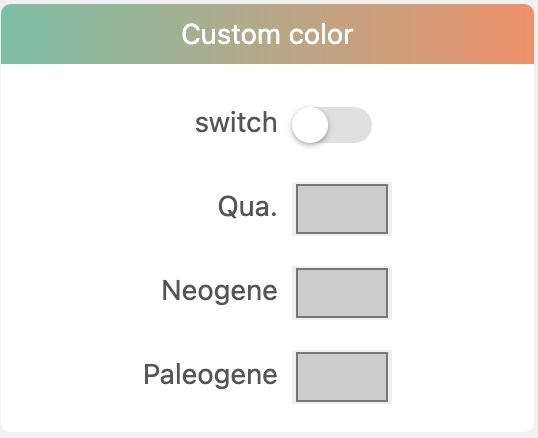
switch: Whether to use custom color set.
All categories of that data column will be listed below followed by a color selector respectively. Click each color selector to select a color you like.
Period style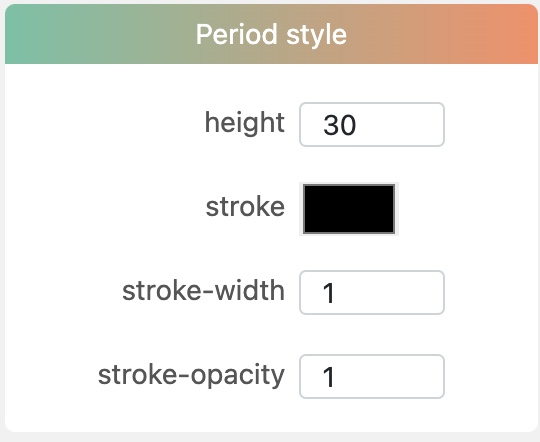
height: The rect height of each period.
stroke: Svg rect attribute.
stroke-width: Svg rect attribute.
stroke-opacity: Svg rect attribute.
Text style
fill: Svg text attribute.
fill-opacity: Svg text attribute.
font-size: Svg text attribute.
font-weight: Svg text attribute.