Layer data
- Example data
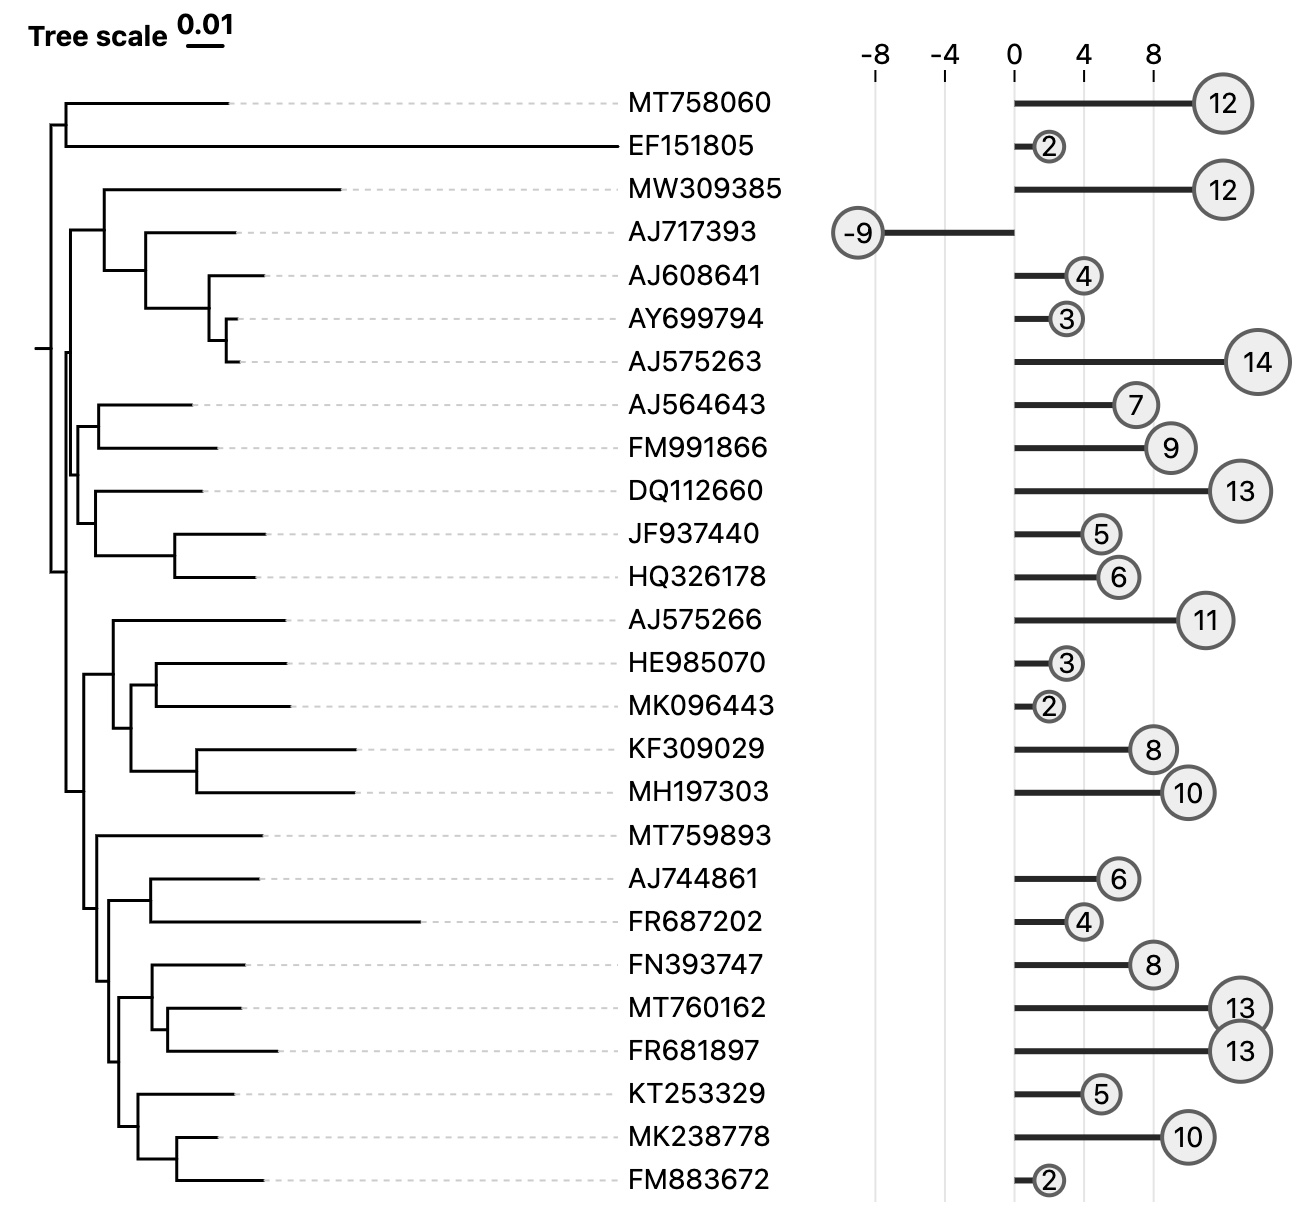
One column of numerical data is needed. If you leave a cell blank, the lollipop of corresponding node will not be drawn.
| Node IDs | Value | ... |
|---|---|---|
| MT758060 | 5 | ... |
| EF151805 | 9 | ... |
| MW309385 | 12 | ... |
| AJ717393 | 13 | ... |
- TSV format
Node IDs    Value
EF151805    2
AY699794    3
AJ608641    4
JF937440    5
AJ744861    6
AJ564643    7
FN393747    8
AJ717393    -9
MK238778    10
AJ575266    11
MT758060    12
MT760162    13
NR_025743    14
FM883672    2
HE985070    3
FR687202    4
KT253329    5
HQ326178    6
MT759893
KF309029    8
FM991866    9
MH197303    10
FR681897    13
MW309385    12
DQ112660    13
AJ575263    14
MK096443    2
Layer controlling attributes
canvas
xAxis
background
lollipop
Lollipop style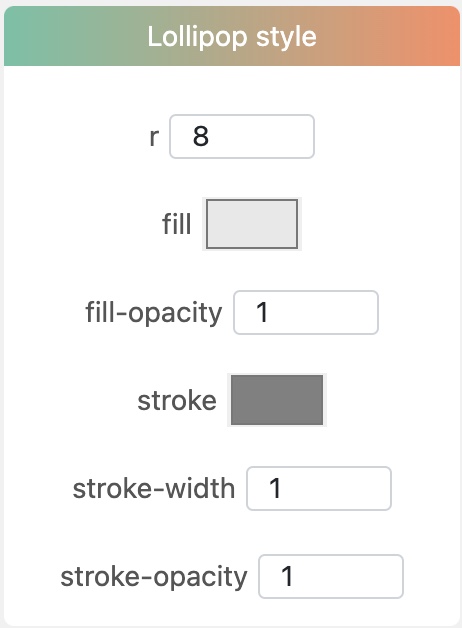
r: Svg circle attribute. The radius of circle in lollipop, valid when the switch in Lollipop size below is off.
fill: Svg circle attribute.
fill-opacity: Svg circle attribute.
stroke: Svg circle attribute.
stroke-width: Svg circle attribute.
stroke-opacity: Svg circle attribute.
Lollipop size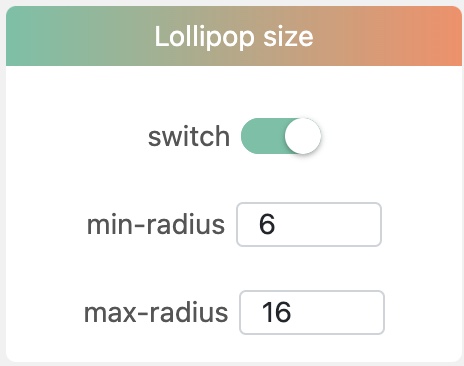
switch: If this switch is on, the circle radius of each lollipop depends on corresponding data value.
min-radius: Minimum radius of the minimum value.
max-radius: Maximum radius of the maximum value.
Line style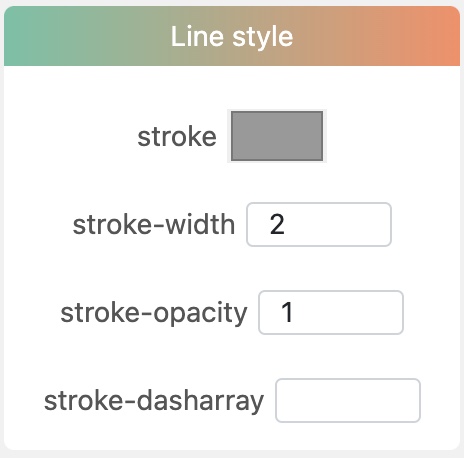
stroke: Svg line attribute.
stroke-width: Svg line attribute.
stroke-opacity: Svg line attribute.
stroke-dasharray: Svg line attribute.
Lollipop text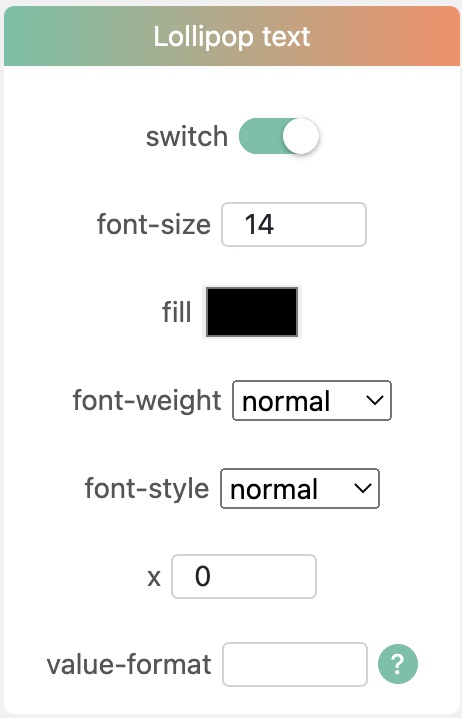
switch: Whether to draw value texts.
font-size: Svg text attribute.
fill: Svg text attribute.
font-weight: Svg text attribute.
font-style: Svg text attribute.
value-format: This attribute is the same as tick format. Click this link for more details