Layer data
- Example data
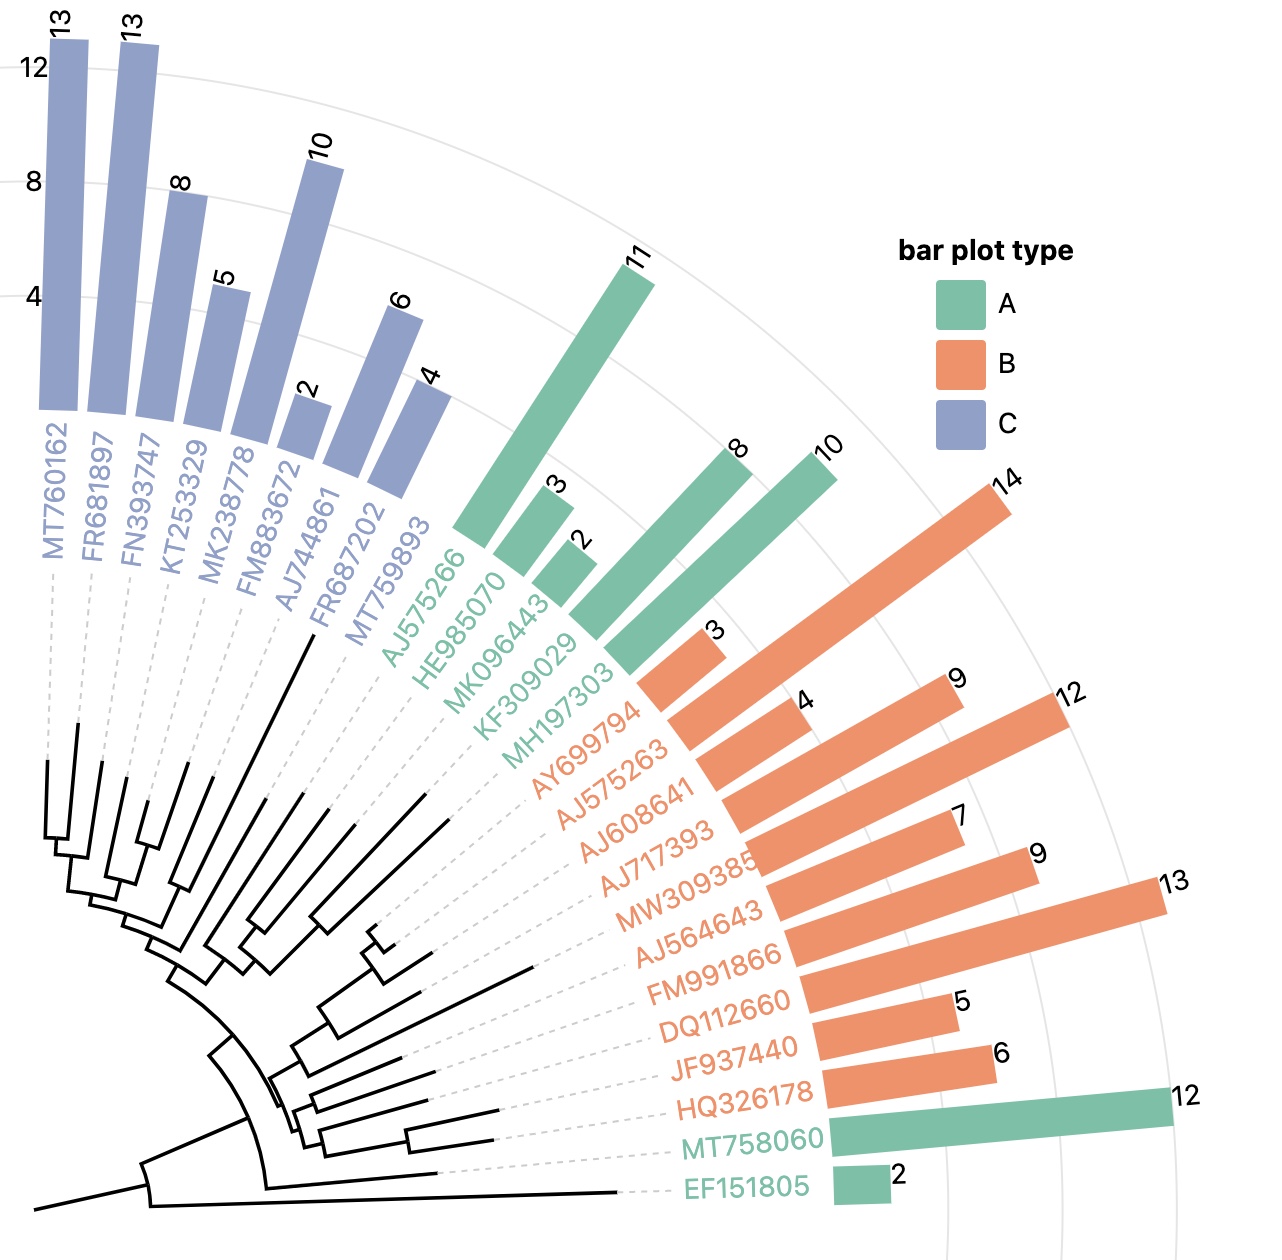
One column of category data and one column of numerical data are needed. If you leave a cell (in the column of numerical data) blank, the bar of corresponding node will not be drawn. When you add this dataset layer, the category column must be selected firstly, and then select the bar value column.
| Node IDs | Categories | Bar value | ... |
|---|---|---|---|
| MT758060 | A | 5 | ... |
| EF151805 | B | 9 | ... |
| MW309385 | C | 12 | ... |
| AJ717393 | B | 13 | ... |
- TSV format
Node IDs    Categories    Bar value
EF151805    A    2
AY699794    B    3
AJ608641    B    4
JF937440    B    5
AJ744861    C    6
AJ564643    B    7
FN393747    C    8
AJ717393    B    -9
MK238778    C    10
AJ575266    A    11
MT758060    A    12
MT760162    C    13
NR_025743    C    14
FM883672    C    2
HE985070    A    3
FR687202    C    4
KT253329    C    5
HQ326178    B    6
MT759893
KF309029    A    8
FM991866    B    9
MH197303    A    10
FR681897    C    13
MW309385    B    12
DQ112660    B    13
AJ575263    B    14
MK096443    A    2
Layer controlling attributes
canvas
xAxis
background
bar
Color set

color: Click this button to choose a default color set.
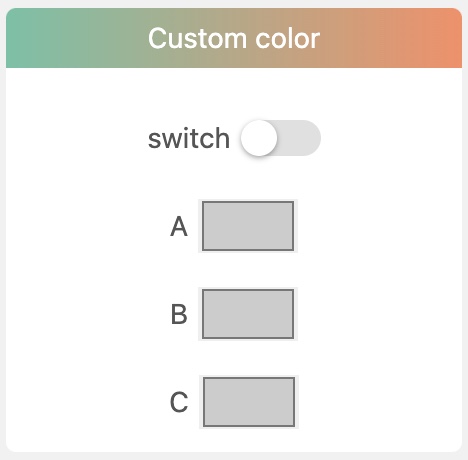
Custom color
switch: Whether to use custom color set.
All categories of that data column will be listed below followed by a color selector respectively. Click each color selector to select a color you like.
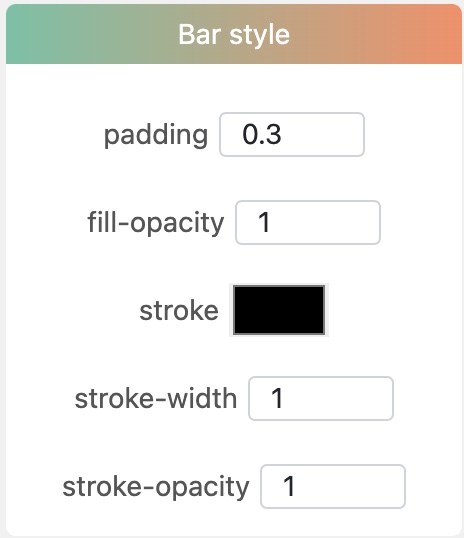
Bar style
padding: Adjust the spacing between two bars.
fill-opacity: Svg rect attribute.
stroke: Svg rect attribute.
stroke-width: Svg rect attribute.
stroke-opacity: Svg rect attribute.
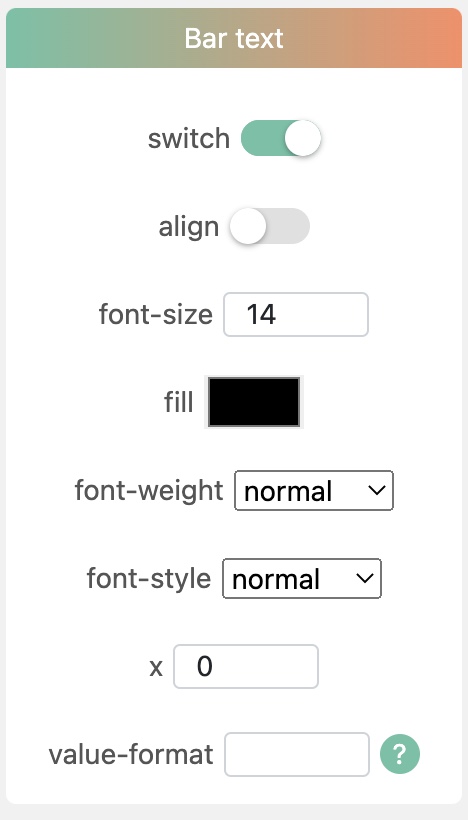
Bar text
switch: Whether to draw value texts.
align: Align value texts.
font-size: Svg text attribute.
fill: Svg text attribute.
font-weight: Svg text attribute.
font-style: Svg text attribute.
value-format: This attribute is the same as tick format. Click this link for more details